Historical Weather Conditions for the Livermore Valley, California
An interesting newspaper article about historical weather recording in the Livermore Valley was published in the East Bay Times on 15 December, 2005 entitled Weather is what you make of it
[The following information was extracted from the Environmental Impact Statement & Environmental Impact Report for Continued Operation of Lawrence National Laboratory and Sandia National Laboratories, Livermore - Section 4.7 Meterology. Copies of the report are available at the Livermore Public Library]
4.7.1 Temperature
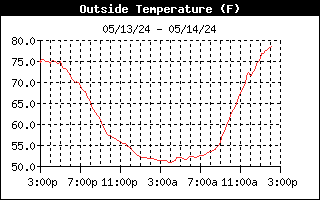
The daily maximum and minimum temperatures for each month for Livermore, California, are shown in table 4.7-1 of the report which references "NOAA 1980-1990". The mean annual temperature for the 30-year period from 1951 through 1980 was 14.5 degrees C (58.1 degrees F) with daily extremes ranging from 7.8 degrees C (18 degrees F) to 45 degrees C (113 degrees F).
4.7.2 Precipitation
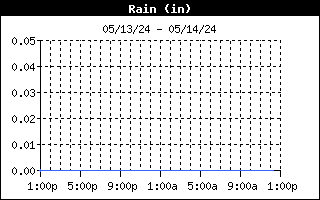
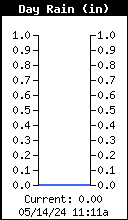
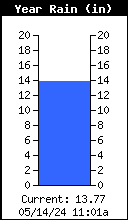
Most rainfall in the Livermore Valley occurs between October and April. The average annual precipitation for the valley is 14.9 inches (NOAA, 1980 to 1990). Table 4.7-2 in the report contains the average monthly precipitation for the Livermore Valley for the years 1980 through 1990.
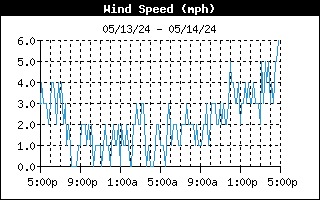
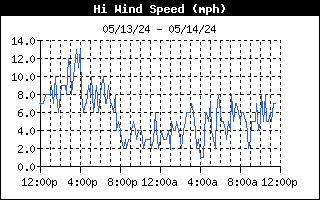
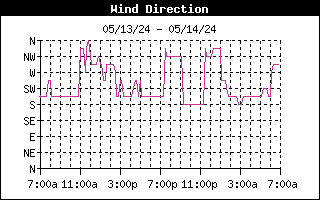
4.7.3 Winds
The Livermore Valley is bowl-shaped, measuring approximately 21 km in length and 7 to 11 km in width. The surrounding hills range from 300 to 600 m above the valley floor. As airflow moves east through Dublin Gap, it diverges until it encounters Mt. Diablo and the Altamont Hills to the north. These obstructions turn the flow toward the southeast. South of the Dublin Gap, the influence of the foothills of the Diablo Mountain Range and the surrounding Altamont Hills then diverts the airflow towards the northeast. Airflow exits the valley through Altamont Pass. Large-scale upper-air influences either weaken or enhance this surface flow pattern.
During the summer months, winds are predominantly from the south or southwest as a result of the sea breeze. The sea breeze phenomenon is created when air over land is heated more rapidly by solar radiation than the air over the cooler Pacific Ocean. As the air is heated it rises and begins to develop a circulation, causing the air over the ocean to move inland. During this period of replacement (which typically occurs between 14:00 and 16:00 Pacific Standard Time), the wind velocity increases. This differential heating rarely occurs during the winter months when winds are more even
4.7.4 Storm Events
The Livermore Valley rarely experiences severe weather. The greatest annual rainfall during the period between 1931 and 1990 was 1041 mm (41 inches)(NOAA, 1980-1990). During the 5 years between 1986 and 1991, California experienced less than normal precipitation, which is 379 mm (14.9 inches). Annual rainfall for the Livermore region for 1986 through 1990 was only 274 mm (10.9 inches), which is 28 percent below normal. This can be compared to the 508 mm (20.0 inches) average for an earlier 5-year period (1980 through 1984), which is 34 percent above normal. Thunderstorms occur fewer than 10 days per year and are not intense, hail occurs even less frequently.
|